1. Six steps of RO system design
A workable RO design does not start with “pick an element” — it starts from the water analysis and the permeate requirements and works backwards. The path below applies to brackish water, surface water, wastewater reuse and seawater desalination; only the parameter values change.
- Fix the feed quality and flow. You need the full ion profile (Ca, Mg, Na, K, HCO₃, SO₄, Cl, SiO₂), TDS, pH, temperature, turbidity and SDI₁₅. A single TDS number cannot predict scaling, nor tell you whether softening or antiscalant is required.
- Fix the permeate requirements. Permeate flow, permeate TDS or rejection, recovery, and whether downstream EDI / mixed bed imposes limits on CO₂ and weak electrolytes.
- Choose elements and design flux. Set average flux by water type: higher for groundwater and RO permeate, conservative for surface water and reuse; also check the lead-element flux ceiling and the minimum concentrate flow in the last stage.
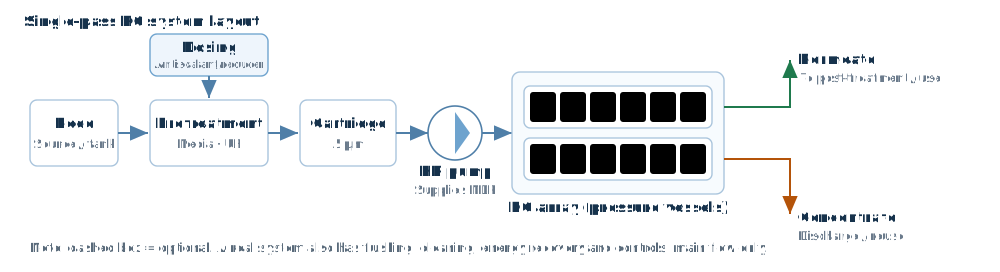
- Set the array and number of passes. Typically 6 elements per vessel, 2:1 or 3:2 arrays; higher recovery means denser concentrate and a longer array. Consider interstage boosting for high recovery or high salinity.
- Calculate pressure, pressure drop and energy. Net driving pressure must cover osmotic pressure, permeate back-pressure and interstage losses; size the high-pressure pump from flow and head, with margin for membrane ageing.
- Check scaling and operating limits. LSI / SDSI, SiO₂ saturation, CaSO₄ and BaSO₄ saturation, free chlorine, temperature ceiling, per-element pressure drop — these decide long-term reliability, not just whether the system passes acceptance.
These six steps are expanded into a checkable list in RO system design steps.
2. Go deeper by topic
Membrane system design steps
From water analysis to array, flux, pressure and scaling checks, with formulas and recommended values.
Element selection guide
How to read model codes, which series fits which water, and the pitfalls of mixing or substituting.
Recovery and rejection
Formulas, worked examples, and how temperature and TDS affect permeate quality.
Design software comparison
WAVE, IMSDesign, DS2, Q+ and CSM Pro — what each can and cannot do, and how to migrate.
Eight brands compared
Choose by application, not reputation: seawater, brackish, reuse, ultrapure.
3. Four common mistakes
1. Treating higher recovery as always better
Higher recovery means denser concentrate: osmotic pressure rises, required pressure rises, scaling and fouling risk rise with it. Brackish systems typically run 65–75%, surface water and reuse 60–70%, seawater first pass 40–45%. Going beyond is possible, but scaling and concentrate disposal must be solved first.
2. Checking average flux only
Meeting average flux does not mean the design is safe. The first element of the lead stage sees 20–30% above average flux. Check each stage individually, and check minimum concentrate flow in the last stage, or concentration polarisation and fouling follow.
3. Ignoring temperature effects on both flow and quality
Permeate flow drops roughly 3% per °C. Many “winter shortfall” cases are not failed membranes but designs evaluated at 25 °C and never checked at low temperature. Conversely, higher temperature raises both flux and salt passage, so permeate quality degrades.
4. Using TDS instead of the ion profile
Two waters at 2000 mg/L behave completely differently if one is calcium-hard and the other sodium-dominant. Without the ion profile you cannot compute LSI or saturation, nor decide on softening, acid or antiscalant.
4. How to read key parameters
A datasheet lists only a few numbers, but each has two readings: the nominal value and the operating value. Miss that distinction and selection can be off by an order of magnitude.
1. Stabilised rejection: the nominal value is at standard conditions, not yours
The quoted rejection (say 99.7%) is measured at standard conditions: fixed pressure, fixed NaCl concentration (1500–2000 mg/L for brackish elements, 32000 mg/L for seawater), 25 °C, 15% recovery. In a real system any deviation in temperature, feed TDS, pH or recovery changes it.
Rule of thumb: salt passage rises about 3–4% per °C, and raising feed TDS from 2000 to 10000 mg/L amplifies permeate TDS roughly 5–8 fold (not a linear 5×). So a “99.7% element” delivering 99.2% at high TDS is normal, not a defect.
2. Flux: average, lead-element and tail-end are three different things
Average flux = total permeate ÷ total area, and it is only a pass mark. Fouling rate is actually driven by the flux of the first element in the lead stage (typically 20–30% above average) and by the concentrate flow at the last element of the final stage.
- Average flux: groundwater / RO permeate 20–26 lmh, tap water 17–22 lmh, surface water 14–18 lmh, wastewater reuse 12–17 lmh, seawater first pass 12–17 lmh.
- Lead-element flux: keep below 1.3× the average, and below the manufacturer maximum.
- Tail-end concentrate flow: usually not below 2.5–3.5 m³/h per 8040 element, higher for heavy fouling duty.
3. Net driving pressure: gauge reading is not driving force
NDP = feed pressure − Δp/2 − permeate back-pressure − average osmotic pressure. Osmotic pressure rises with TDS: about 24 bar at 35000 mg/L seawater versus roughly 1.7 bar at 2000 mg/L brackish — the fundamental reason seawater systems run at much higher pressure.
A common mistake is reading only feed pressure: the same element may produce water at 10 bar with low TDS but need more than 20 bar at high TDS — all of the difference sits in the osmotic term.
4. Pressure drop: the element’s blood pressure
A healthy 8040 element drops about 0.3–0.7 bar, with manufacturer limits around 0.9–1.0 bar. A sudden rise usually means excessive feed flow, insufficient concentrate flow, spacer fouling or scaling. Check it per stage at design time, not after the alarm.
5. Recovery and concentration factor
CF = 1/(1 − recovery). 75% recovery means 4× concentration, 80% means 5×. CaSO₄, BaSO₄, SiO₂ saturation and LSI on the concentrate side all scale with it — each additional 5 points of recovery raises scaling risk non-linearly.
5. Design differences by water source
Same technology, very different design intent. The table gives commonly used engineering ranges; always confirm with a full water analysis and manufacturer software.
| Source | Typical recovery | Design flux (lmh) | Key control points |
|---|---|---|---|
| Deep well / groundwater (SDI<3) | 70–80% | 20–26 | Iron, manganese, hardness, CO₂; scaling mostly CaCO₃ |
| Tap / municipal supply | 65–75% | 17–22 | Free chlorine must be removed (<0.1 mg/L) or the membrane oxidises irreversibly |
| Surface water (SDI 3–5) | 60–70% | 14–18 | Turbidity, organics, algae; strengthen pretreatment and use conservative flux |
| Municipal wastewater reuse | 55–70% | 12–17 | COD, ammonia, micro-organisms; fouling-resistant elements plus UF upstream |
| Seawater (first pass) | 40–45% | 12–17 | High pressure, high osmotic pressure, boron and chloride; energy recovery is essentially mandatory |
Two details that are easy to miss:
- Pretreatment should match the problem, not the budget. High SDI and turbidity call for UF; high organics call for activated carbon or softening; chlorine only needs reductant plus ORP interlock.
- Check low-temperature conditions separately. Many “winter shortfall” systems were only evaluated at 25 °C — re-check flow and pressure at the local minimum monthly water temperature.
Three figures: pressure, concentration and process
6. FAQ
Q: Same element, same feed — why does my pressure differ from the vendor software by a few percent?
Three usual causes: (1) vendor software uses its own temperature/concentration correction curves, which change between versions; (2) different osmotic pressure algorithms (permeate side included or not, activity coefficients used or not); (3) different empirical exponents in the pressure-drop model. Within 3% is normal; above 5%, verify the test conditions (salinity, temperature, recovery) item by item.
Q: Can different brands be mixed in one system?
Technically yes, but avoid mixing within the same stage. Different flux-decline behaviour and pressure-drop coefficients cause uneven flow distribution, so individual elements foul or overload early. If you must mix, keep each stage uniform and put the higher-flux elements in the lead stage.
Q: Rejection suddenly dropped from 99.5% to 97% — why?
In order of likelihood: (1) membrane oxidation from excess chlorine (irreversible); (2) O-ring leak or failed permeate-tube seal (bypass); (3) scaling or fouling worsening concentration polarisation; (4) a sudden rise in feed temperature. Check chlorine/ORP records first, then individual element permeate quality — that quickly separates a failed membrane from a leaking seal.
Q: Can recovery go above 85%?
Yes, but the concentrate approaches or exceeds solubility limits: softening, silica removal and combined antiscalant are needed, and the tail end usually requires further concentration (e.g. DTRO). A conventional single-pass RO at 85% gives 6.7× concentration where CaSO₄ and SiO₂ almost always exceed limits; a single antiscalant rarely holds long term.
Q: Why does the lead stage foul more than the tail?
The lead stage has the highest flux and turbulence, so colloids and suspended solids deposit there first; the tail stage has the highest concentration and lowest velocity, so scaling and polarisation dominate. The two stages need different cleaning strategies: particulate/colloidal at the front, scaling and biofouling at the back.
7. Where the data comes from
All element parameters (area, stabilised rejection, pressure rating, temperature and pH limits, pressure-drop coefficients, temperature correction) come from manufacturer technical and marketing literature plus official design-software test data, normalised to a single basis. Current coverage:
Hydranautics 135, Toray 123, CSM 89, DuPont 81, Ovay 42, LG 38, Vontron 37, Veolia 188 elements — 8 manufacturers in total.
Parameters change with manufacturer revisions. Before engineering delivery, verify against the latest datasheets and official software; the data here is intended for comparison and quick checking on a common basis.
Finish the design in your browser
733 elements from 8 manufacturers built in, with same-condition comparison, project import and report export (Excel / PDF / Word).
Sign in See features