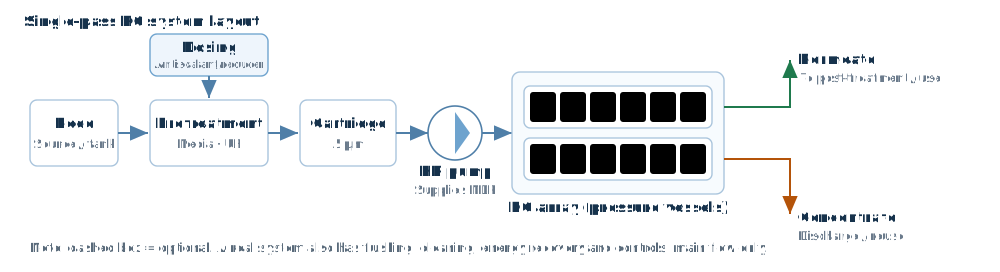
1. Describe the feed water first
The first input to an RO design is not a model number — it is a complete water analysis. It must include cations (Ca²⁺, Mg²⁺, Na⁺, K⁺, Ba²⁺, Sr²⁺), anions (HCO₃⁻, SO₄²⁻, Cl⁻, NO₃⁻, F⁻), SiO₂, CO₂, pH, temperature and TDS, plus turbidity, SDI₁₅, free chlorine, iron and manganese, and COD/TOC.
Three of these are routinely left out and each one changes the design:
- Alkalinity and pH — they set LSI and whether acid dosing is needed; they also drive CO₂ passage and therefore the load on a downstream EDI.
- SiO₂ — above roughly 100 mg/L on the concentrate side (25 °C, near-neutral pH) silica scaling becomes a risk, and silica scale is very hard to remove chemically.
- Free chlorine — polyamide membranes tolerate almost none; the usual limit is below 0.1 mg/L, so upstream sodium bisulfite dosing plus an ORP interlock is mandatory.
2. Fix recovery, then area
Recovery R = Qp / Qf × 100%; concentrate flow Qc = Qf − Qp. Once recovery is fixed, the concentration factor CF = 1 / (1 − R) is fixed too: 75% recovery means 4× concentration, 80% means 5×. Concentrate salinity, osmotic pressure and scaling risk all scale with that factor.
Area comes from the design flux: A_total = Qp / J. For 100 m³/h of permeate at 17 LMH you need about 5880 m² of membrane; at 37 m² per element (400 ft²) that is roughly 159 elements, and after rounding to vessels you would typically install 160–180.
3. Choosing design flux
Design flux is empirical: it depends on the feed type and how good the pretreatment is. Commonly used ranges for 8040 elements at an annual average water temperature of 20–25 °C:
| Feed type | Average flux (LMH) | Average flux (GFD) | Notes |
|---|---|---|---|
| RO permeate / clean groundwater | 20–26 | 12–15 | Low fouling load, upper end acceptable |
| Tap water / well water (SDI < 3) | 17–22 | 10–13 | Most common range |
| Surface water (SDI 3–5) | 14–18 | 8–11 | Strengthen pretreatment |
| Municipal wastewater reuse | 12–17 | 7–10 | Fouling-resistant elements recommended |
| Industrial wastewater / high COD | 10–14 | 6–8 | UF plus activated carbon upstream |
| Seawater (first pass) | 12–17 | 7–10 | High pressure, low recovery |
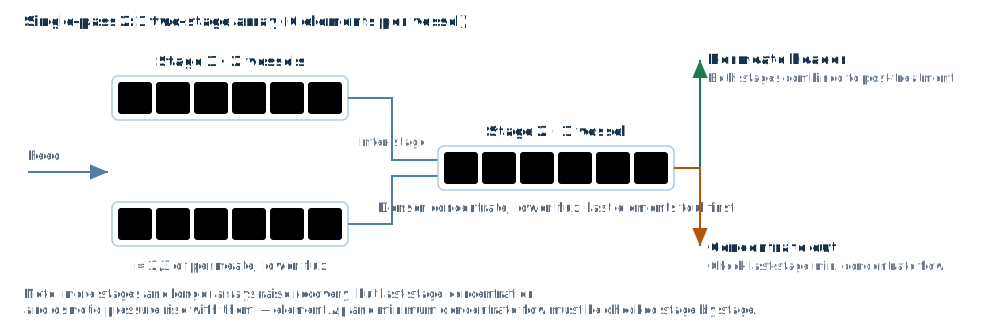
Average flux is only one constraint. You must also check the lead-element flux (normally no more than 1.3× the average, and never above the manufacturer's ceiling) and the minimum concentrate flow at the tail (usually not below 2.5–3.5 m³/h per 8040 element, higher for seawater and heavy fouling duty).
4. Array and number of passes
Single-pass systems commonly use 6 elements per vessel in a 2:1, 3:2 or 4:2 array. The array is really a way of distributing membrane area while keeping tail concentrate flow and cross-flow velocity acceptable:
- 2:1 (e.g. 12 + 6 vessels) — simple, suits small and medium systems at 65–75% recovery.
- 3:2 — more area in the second stage, suits higher recovery or low water temperature.
- Long arrays (e.g. 4:2:1, three stages) — for recovery above 80%, together with interstage boosting and antiscalant.
Once the array is set, recalculate flux, concentrate flow and pressure drop per stage. More stages mean more interstage piping, more booster pumps and more pressure loss — more is not automatically better.
5. Pressure, pressure drop and energy
Net driving pressure NDP = P_feed − ΔP/2 − P_permeate − π_avg, where π is the average osmotic pressure across the membrane. Osmotic pressure can be estimated as about 0.85 bar per 1000 mg/L for pure NaCl at 25 °C, and commonly 0.7 bar per 1000 mg/L for natural multi-ion water; the accurate value should come from the ion composition.
On pressure drop: a single 8040 element is usually limited to 0.9–1.0 bar, and a whole stage losing much more means blocked channels or excessive flow. High-pressure pump power P = Qf × ΔP / (36 × η) with Qf in m³/h, ΔP in bar, P in kW and η the pump efficiency.
The order for cutting energy is: reduce the recovery requirement, then pick low-energy elements, then consider energy recovery (seawater), and only then look at pump efficiency — the first two usually matter far more than the pump.
6. Concentrate-side checks
Concentrate saturation is the hard constraint on system life. Check it stage by stage:
- LSI — keep concentrate LSI within about +1.8 when antiscalant is used; close to 0 without it.
- SiO₂ — concentrate SiO₂ should stay below about 100 mg/L at 25 °C; higher temperature or pH allows some relaxation, but confirm with the manufacturer.
- CaSO₄, BaSO₄, SrSO₄ — expressed as percent saturation; above 100% you need softening or a dedicated antiscalant.
- Concentrate flow — too little flow per tail element causes concentration polarisation and fouling, which shows up first as a fast rise in pressure drop.
7. Pre-delivery checklist
- Complete water analysis, with cation/anion equivalent balance within 5%
- Recovery, concentration factor and concentrate disposal route all defined
- Average flux, lead-element flux and tail concentrate flow all within limits
- Low-temperature case (e.g. 10 °C or the local minimum monthly temperature) still meets the permeate flow requirement
- Concentrate LSI / SiO₂ / sulfate saturation acceptable, with antiscalant type and dose specified
- Free chlorine, ORP, temperature and pH interlocks and alarm setpoints defined
- High-pressure pump head includes 10–15% ageing margin, interstage boosting accounted for
- Per-element and per-stage pressure drop within limits
Finish the design in your browser
733 elements from 8 manufacturers built in, with same-condition comparison, project import and report export (Excel / PDF / Word).
Sign in See features